Honey, I shrunk the spectrometer

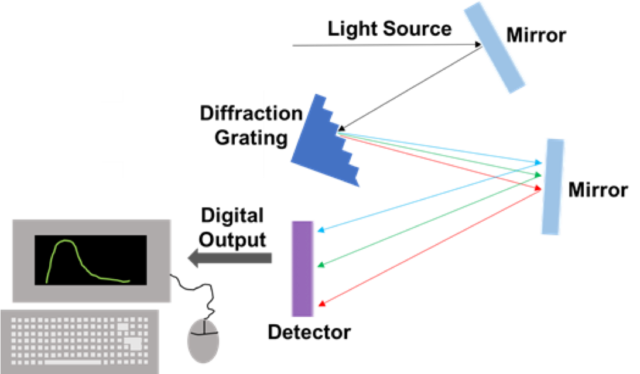
From our eyes to microscopes to electronic read-out systems, optical spectrometers come in many forms. While optical spectrometers can vary greatly, they all consist of multiple components that work in harmony to focus, separate and detect light of varying wavelengths. The diagram given below shows the typical structure of a classic benchtop electronic read-out spectrometer.
Scientists have been using optical spectroscopy for centuries, in 1665 Robert Hooke observed ‘block like’ structures under a microscope that he would later terms ‘cells’1. As time progressed, science’s ability to manipulate, bend and separate light has advanced, yielding improved resolution limits (smaller and smaller structures can be seen clearly).
Single nanowire spectrometers
Recently, researchers published the fabrication of a ‘nanowire spectrometer’ in which all the functions of a traditional optical spectrometer are coupled into one single material – the nanowire. Nanowire spectrometers differ from traditional spectrometers (illustrated above) in that traditional spectrometers have an array of mirrors for manipulating light, diffraction gratings for separating light based on wavelengths and separate detector systems.
The single nanowire’s composition allows the spectrometer to combine both the separating and detecting elements into one simple material. The nanowire has a composition gradient along its length, meaning that as you go along the wire the composition changes. At one end, it is composed entirely of cadmium sulfide (CdS), as you go along the length of the nanowire, atoms of sulfur are replaced by an element known as selenium until you reach the opposite end of the nanowire composed entirely of cadmium selenide (CdSe).
CdS and CdSe have different electronic structures, with collections of energy levels which are either filled with electrons or devoid of electrons. These energy levels are separated by an energy gap known as the ‘band gap’2. The band gap of a material determines the colour of light that it will absorb. This means that as the nanowire changes composition, it also changes the colour of light it will absorb. This leads to a structure that absorbs multiple colours of light, but at different positions3.
A variety of ‘cells’ can be set up by placing electrodes beneath the nanowire. Each cell absorbs a particular colour of light, giving a corresponding electrical current related to the intensity of the light absorbed. For example, red onion cell membrane mounted above the spectrometer and illuminated with white light (from a classic light bulb), will show the light coming through the onion cell as red-purple. This light is separated and detected by the nanowire spectrometer. The photocurrents (electrical currents generated in the cells when light is absorbed) are then computationally reconstructed as pixels of a certain colour and intensity.
By dividing the surface of the onion membrane into squares, a light spectrum can be collected for each square, from which a scanned image can be constructed of the entire membrane. Thus, nanowire spectrometers offer the potential to obtain spectral images of cellular structures and components. This enables both observation of cellular processes and recording of the spectroscopic data at the same time, giving insight into what is happening at a fundamental molecular level.
Future Applications
Miniaturisation of spectrometer devices will allow for high resolution non-destructive studies of key cellular processes, advancement of drone technology and lab-on-chip devices.
Edited by Frankie Macpherson
Author
References
- Hooke, R. Micrographia, Or, Some Physiological Descriptions of Minute Bodies Made by Magnifying Glasses, with Observations and Inquiries Thereupon; Dover Publications: New York, 2003
- http://news.mit.edu/2010/explained-bandgap-0723
- www.pveducation.org/pvcdrom/pn-junctions/absorption-of-light