Can really *everyone* be a data scientist?
On season four of ‘Star Trek The Next Generation’, android Lieutenant Commander Data describes a typical day in his life. Concluding his story, he muses that he will “continue [to be] learning, changing, growing, and trying to become more than what [he is]”. Similarly, in our heavily digitised environment, we are confronted with ever more and different forms of data. Every breath you take, and every move you make can be turned into information (and ’the police‘ are definitely watching). Google knows where you are, Facebook can predict how you vote, and soon enough, your smart fridge will learn to cater to your appetite. Data is heralded as the “oil of the 21st century”1 by tech company executives and CEOs. Big data and machine learning have become buzzwords, and ‘data scientist‘ has even been named ‘the sexiest job of the 21st century‘2.
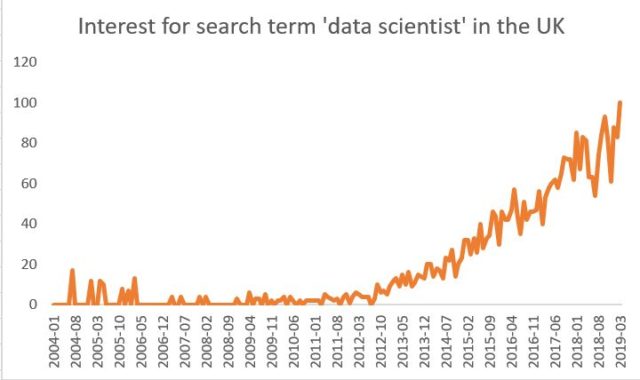
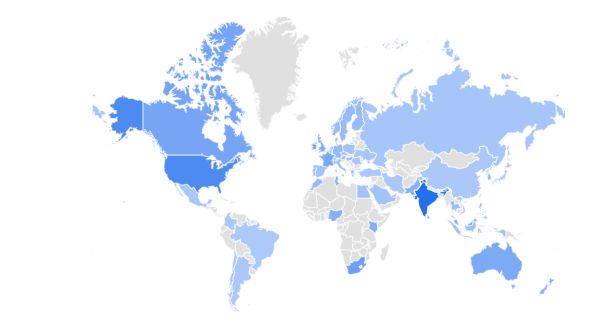
But who are these data scientists? And what do they do?
Data scientists are people, often with a formal education in mathematics, statistics or research, who take large swaths of messy data and tidy it into a sensible format. In the next step, they visualize the information and highlight surprising or important aspects of the data set. In recent years, we have seen some articles and blog posts claiming that ’everyone can be a data scientist’. Is this really possible? I would chime into this chorus and argue yes, to some extent it is. However, it is important to highlight that there are a few key ingredients that go into making data science accessible to everyone and can empower those who would like to interpret data to do so.
One form of data that has received markedly less attention in the media but nonetheless has the potential to enable everyone to engage in data science is open data. While many have painful associations with the misuse of personal and sensitive information, open data is on the contrary defined as anonymized and aggregated data points. Joel Gurin3 writes in the Guardian that big data and open data are ‘closely related’, but not equivalent. Open data he says is “accessible public data that people, companies, and organisations can use to launch new ventures, analyse patterns and trends, make data-driven decisions, and solve complex problems.” Big data, on the other hand, can but does not have to be open.
Big, open, or both?
For example, we would turn to big data sets, if we want to train a computer algorithm to distinguish between images of dogs and cats. In order to teach our algorithm reliably what constitutes a dog and what a cat in an image, a very large data set of pictures it needed. Dealing with big data requires quite a lot of time, resources and storage space. On the other hand, open data for example allows us to download an excel sheet, store it on our computer and interact with it to answer any question we can come up with. We would not find any personal information in there, but rather aggregated results of how many people walk along the streets of Glasgow each day, to help save energy and inform the timing of street
lights4.
From open to citizen science
If you are a researcher, there is a good chance you have heard of the replication crisis in fields like Psychology, Oncology and Genetics. To counteract questionable research practices, scientists have started sharing their data, materials and articles through platforms such as PsyArXiv5, the Open Science Framework6 and Figshare7. Not only researchers are making data available. Governments and the public sector are following suit. The idea is to promote citizen science and ‘boost democracy‘ by empowering everyone to participate8. Another, perhaps unexpected, source of open data is the web itself. It is nowadays almost ridiculously easy to go on Twitter and (if you are so inclined) download almost every single thing Donald Trump has ever tweeted.
With more and more data being created every time you type a search query into Google or swipe right on Tinder, we can expect that the need for people grappling with this ever-growing tide of information is increasing as well. Among those millions of petabytes to come, we will likely encounter entirely new forms of data as well. The trend of widening access to data is scaled by legislation supporting it. In December 2018, the US Senate passed the Open, Public, Electronic and Necessary Government Data Act 9. The same tendency can be seen in the EU, with the embrace of the G8 Open Data
Charter 10 and the funding invested in open data projects embedded with Horizon 2020 and beyond. Both reforms have the goal of promoting the opening up of data sets to support a more democratic and engaged society, as well as foster entrepreneurship and innovation.
Open data at your fingertips
If you are wondering which factors contribute to areas of multiple deprivation in Glasgow, you can go online, download the dataset 11 and start exploring. If you want to know which Radiohead song is the most depressing, visit: rcharlie.com12. The data is there and ready for you to play with. And if you want to plot the most frequently used words on your Twitter timeline – they are only a mouse click away13.
Okay, fine, you might say – I have downloaded the data, now what? Contrary to popular belief, data analysis is not an elitist skill possessed only by highly specialized experts and researchers. Along with the trend of increasing access to open data, there is also a wide variety of open source software available, like R14 or Python15, to wrangle with these datasets you just acquired.
While writing code might seem inaccessible at first glance, there are now many initiatives in place to get everyone interested and involved in the process of programming. To learn how to use an open source software like R, you can go to Coursera, use the training environment that comes with R itself (‘swirl’16) or sign up for any free massive online open course (MOOC) currently available. And programming doesn’t have to be dry or detached from everyday life. It can be fun, colourful and can feel incredibly empowering. With minimal training, a bit of curiosity and an internet connection, anyone can be a data scientist.
More than spreadsheets
Another barrier to engaging with open data can be the perception of complicated and inaccessible spreadsheets. In fact, Yang and Kankanhalli (2013)17 report a lack of interest by external users to take advantage of government data for innovative implementations. Juell-Skielse and colleagues (2014)18 found that the public reported “fun and enjoyment” as the main source of motivation when engaging with open government data. Thus, one approach to engage an even wider audience in data science could be to emphasize the beauty and aesthetics of data visualization.
Putting an emphasis on visualisation can make the experience of the data more visceral and can feel motivating when you are writing your first computer code. Nowadays there are platforms that make data exploration even more intuitive by automating visualisation or providing interactive websites to playfully explore supposedly dry excel spreadsheets. The success of data aesthetics is documented via various online blogs and Twitter accounts such as “Information is beautiful”19 or ‘accidental aRt’20.
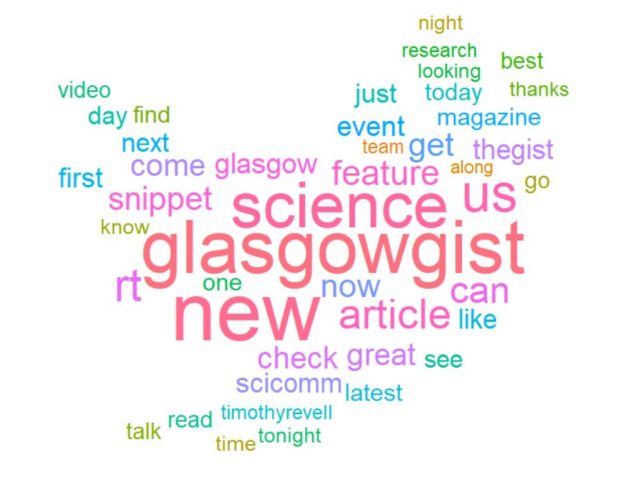
To illustrate the above points, let’s conclude with a wordcloud of the most tweeted words by @GlasgowGist. With just a few lines of code in R we scrape the data from Twitter, get it into a tidy form and plot it. Seems pretty simple, doesn’t it?
This article was specialist edited by Kirstin Leslie and copy-edited by Sylvia Drozdzik .
Author
References
- https://economictimes.indiatimes.com/magazines/panache/data-is-the-21st-centurys-oil-says-siemens-ceo-joe-kaeser/articleshow/64298125.cms
- https://hbr.org/2012/10/data-scientist-the-sexiest-job-of-the-21st-century
- https://www.theguardian.com/public-leaders-network/2014/apr/15/big-data-open-data-transform-government
- https://www.theguardian.com/public-leaders-network/2015/apr/21/glasgow-the-making-of-a-smart-city
- https://psyarxiv.com
- https://osf.io/
- https://figshare.com/
- https://www.theguardian.com/public-leaders-network/2015/feb/20/open-data-day-fairer-taxes
- https://www.datacoalition.org/open-government-data-act/
- https://opendatacharter.net/g8-open-data-charter/
- https://data.glasgow.gov.uk/dataset/scottish-index-of-multiple-deprivation-simd-geographic-access-domain-2004-2012-glasgow
- https://www.rcharlie.com/post/fitter-happier/
- https://rtweet.info/
- https://cran.r-project.org/
- https://www.python.org/
- https://swirlstats.com/
- https://link.springer.com/chapter/10.1007/978-3-642-38862-0_47
- https://link.springer.com/chapter/10.1007/978-3-662-44426-9_23
- https://informationisbeautiful.net/
- http://accidental-art.tumblr.com/


Hi Anna, you have really done great work, you ‘ve carefully selected great resource on big data for business. I benefited much from it. It relates to our blog on:
big data for business
Thank you so much for this great post. I watched your
publications previously, however this one I think about the very best.
How did you find numerous facts? I enjoy the way you arrange everything, because it’s really
simple to read. In general, I will recommend this report to
everybody who is interested in that subject.