And Now For Something Completely Similar

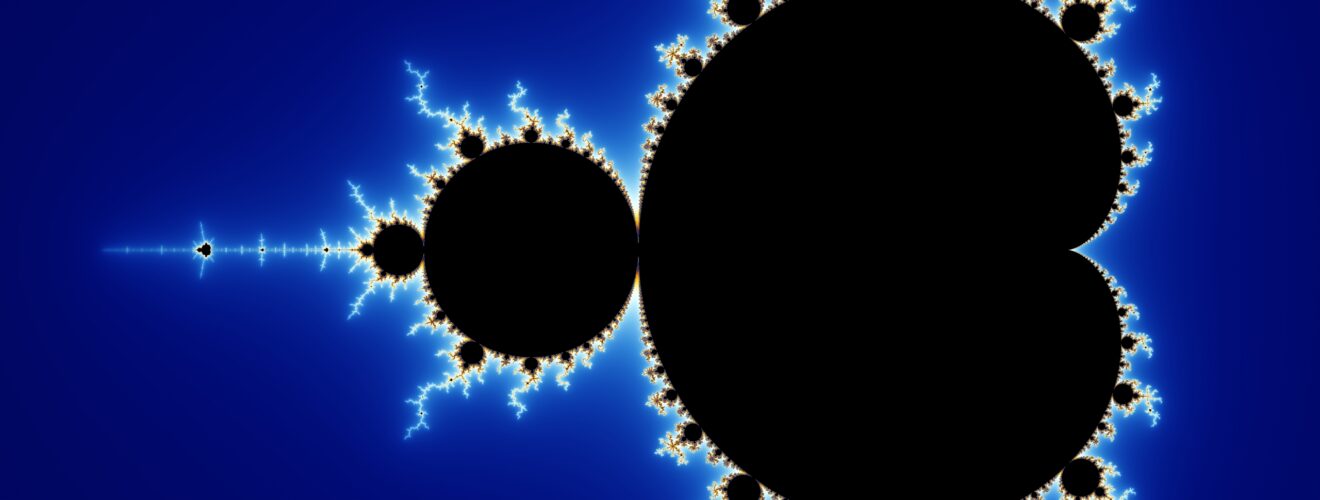
The Mandelbrot set is a magnificent mathematical object that resembles the most intricate piece of artwork. Before writing any more let’s LOOK at the Mandelbrot set.
Beautiful, isn’t it? One thing to notice about the image is how each substructure looks a lot like the whole picture. The Mandelbrot set is self-similar, but each substructure is not identical, it is in fact infinitely complex.

Magnifying the structure of the Mandelbrot Set
Image credit: Wolfgang Beyer with the program Ultra Fractal 3
You can see how the same sort of structures are replicated again and again but in finer detail each time. This is the defining feature of fractals. The Mandelbrot set which we have pictured here is just one example of a fractal. There are many others, all of which are generated by simple rules that cause complex structures and, as you magnify each region, you see self similarity.

Top left moving clockwise: Dragon curve, Sierpinski carpet, Koch curve and the Jerusalem cube. Image credit: wikicommons
The Mandelbrot set is named after the founding father of fractals Benoît B. Mandelbrot. Mandelbrot was a Polish-born French and American mathematician, who lived between 1924 and 2010. It is often joked that the “B.” in Benoît B. Mandelbrot stands for Benoît B. Mandelbrot, as a reference to his work on fractals, however it actually doesn’t stand for anything at all! Mandelbrot spent 35 years of his academic career at IBM, eventually becoming an IBM fellow.
Mandelbrot is perhaps best known for his book “The Fractal Geometry of Nature” in which he described many different fractals, including the Mandelbrot set. Though many of the objects in the book had already been studied by other mathematicians, it was Mandelbrot who brought them together as one general phenomenon. Since Mandelbrot was working at IBM, he had access to some of the most advanced computers of the time, which allowed him to make computer visualisations of his work. By including many of his images in the book, Mandelbrot was able to capture the imaginations of mathematicians, academics and members of the public from around the world. In 1999, American Science magazine voted the Fractal Geometry of Nature as one of the ten most influential scientific essays of the 20th century.
You might think that the Mandelbrot set is just a pretty piece of mathematics that isn’t very useful, but you would be wrong! The real world applications of fractals are vast and far-reaching. One example is the fractal compression of digital images. The usual compression method for a JPEG image requires splitting the image into a grid and then using a simple formula to reduce the information needed to recreate each grid in the image. This causes the file size to decrease, but can result in a loss in overall picture quality. Fractal compression works by taking the idea that many small parts of the image look like the rest. A formula is then used to generate a “fractal instruction list”, which can then recreate the image, using just a few small segments. This results in a better quality compression, which often requires less memory. The resulting file type is called Fractal Image Format (FIF).
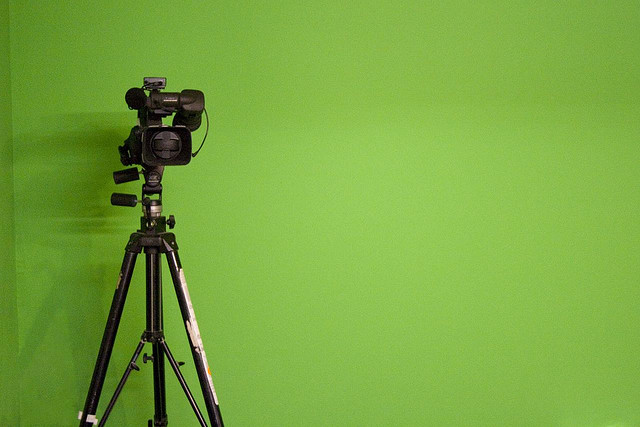
Fractals are easy to create at home. All you need is a video camera and a monitor. Connect the video camera to the monitor and then film the monitor. If you get the angle right, you will find that the monitor displays a series of images of the monitor, each one smaller than the last, nested inside each other, as shown below. There was research done on a similar situation in the Optics Department at the University of Glasgow. The researches looked at what happens when you have two mirrors facing each other. It was discovered that the exact fractal nature that occurs is determined by the edges of the mirror. To celebrate this work, in the Kelvin Building at the University of Glasgow, there is a demonstration consisting of a monitor and a video camera that you can change the angle of to observe the effect.

Television within a television within a television… Image Credit: Lynn Friedmann via Flickr ( License )
There are many other applications of fractals, including the study of diffusion, weather, veins, bacteria cultures, clouds, galaxies and the stock market. Fractals are often seen in nature, just take a look at the Romanesco broccoli.

The Romanesco broccoli, fractal by nature. Image Credit: Leon Brocard via Flickr ( License )
One of the most magnificent things about the Mandelbrot set is that, although it is infinitely complex, it comes from a very simple equation, z = z^2 + C. The letter C represents a fixed choice of number and z changes as we try to work out whether C is in the Mandelbrot set or not. To calculate whether C is in the Mandelbrot set, we must iterate this equation. This means that, starting at zero, we give a value to the z in the left hand side of the equation. We compute the value of z^2+C and this gives the new value of Z, we then repeat this process. C is deemed to be in the Mandelbrot set if the sequence of z’s does not become infinitely large. This is best illustrated through an example. Suppose that we want to know whether -1 is in the Mandelbrot set or not. To do this, we set C=-1, then calculate the right hand side of the equation, with z=0. This gives 0^2+-1 = 1. We then set z=1 and calculate the right hand side again. We again repeat this process, which is summarised in the table below.
Iteration Value of z
0 0^2 + -1 = -1
1 (-1)^2 + -1 = 0
2 0^2 + -1 = -1
3 (-1)^2 + -1 = 0
4 0^2 + -1 = -1
5 (-1)^2 + -1 = 0
…
This choice of C causes a sequence of z’s that alternate between 0 and -1, and since this does not become infinitely large, C is in the Mandelbrot set.
We have simplified the picture here a little. To get the full Mandelbrot set, we also have to consider complex numbers as possible choices for C. (We won’t get into the details here but for the aficionados amongst you, let C be any complex number and then calculate if the magnitude of Z tends to infinity or not.)
A complex number has a real part, which is what we have been working with, and an imaginary part. We use a similar procedure to see whether each complex number is in the Mandelbrot set and then we plot this on a graph, where the x-axis represents the real part and the y-axis represents the imaginary part.
This provides the exact image of the Mandelbrot set, but to make things more interesting, we colour the points that were not in the set, based on how quickly they become infinitely large. This is how we obtain the image that was given at the beginning of this article.
Fractals combine mathematics, computer science, art and an awful lot of awesomeness. The Mandelbrot set is defined via a simple equation and its behaviour under iteration. By then putting the results on paper, we discover a fascinating picture that looks, and is, infinitely complex, yet we know it comes from nothing but a simple equation. This is what is so remarkable about the study of fractals and what makes them so interesting. As a final thought, here is a quote from Mandelbrot himself: “Fractal geometry is not just a chapter of mathematics, but one that helps Everyman to see the same world differently.”


